Following the introduction of satellite internet connection the Vessel API is the logical next step in vessel-to-shore communication. The potential it offers is huge - data from every machine and human on your vessel, available in any structure you want. And in years to come, it will seem like a no-brainer for this data to be embedded in your dashboards and across your supply chain.
So let’s take a look at the types of data available through the Onboard Vessel API, introduce the GraphQL standard it follows and why that is important, and look at some basic queries that anyone can do with a little training.
Types of data available through the Onboard Platform
The Onboard Platform’s key point of differentiation is the range and volume of vessel data it collects. As an equipment-agnostic solution, it can gather data from every possible human, machine, system or sensor on board. But broadly speaking, this means two major types of data.
The first kind of data - known as relational data - is manually logged by the crew on the vessel in the Onboard Digital Logbook. These data are typically low in volume and high in complexity, with many rules that govern what is and is not valid. For example, a voyage is made up of a number of activities, and assigned to a vessel. This means that activities are normally a part of a voyage, and the voyage must be assigned to the same vessel that is performing the activity. Or, the start date and time of anything need to chronologically be before the end date and time. And so on. As these data are logged by humans, there is also a risk of human error, so manually validating the data is sometimes necessary.
The second type - known as time series data - is automatic data collection. This is all the measurements being read from the vessel’s machines. The Onboard Platform typically records a value every 10 seconds, and there are many different kinds of values. For example, a basic vessel’s readings may include fuel consumption from two engines and two generators, GPS position, speed over ground and through water. This already amounts to roughly eight samples every 10 seconds. And the more complex the vessel, the larger the volume of data read. However, while this data is high volume, it is much less complex than relational data and not subject to human input error.
Introducing the GraphQL standard
That gives you a brief idea of the types of data you can collect if you implement the Onboard Platform. And the standard way you access data of this nature is through an API (Application Programming Interface).
However, not all APIs are the same. There are a number of different API standards used today, including REST, SOAP, Query-based, and more. When we built Onboard, we were determined to ensure that the rich data collected by the Onboard Platform should be accessible as easily as possible, with the most up-to-date technology. And so after some careful deliberations about what standard to choose, we settled on GraphQL, as it offers the best balance between ease of use, tooling, and comes in a form that is easy to understand for humans as well as machines.
Some of the key benefits of GraphQL in the context of Onboard include the following:
-
With most other API standards, it is the server that determines what data is sent to the client. This means that with technologies like Rest and SOAP, clients usually get more data back than they really need. But with GraphQL, users are able to query and receive only the exact information they need.
-
The basis of any GraphQL API is its schema, which is a complete and understandable description of all the data that’s available. The schema gives the API very detailed self documenting properties - meaning that unlike other API standards, no external documentation is required. Everything you need to know can be found in the API itself.
-
A GraphQL API schema is (much like databases) organised in types and fields (not in endpoints). This means that the clients, as well as only being able to ask for what’s possible, can give users clear, useful error messages, which communicate what is not correct about your request so you know what to adjust. The types can be used by clients to prevent having to write manual parsing code. The type system also helps to support a wide variety of powerful development tools that make the development cycle that much more efficient.
As the Onboard Platform is basically a powerful data collection system. GraphQL is a very natural fit to make all that collected data available to a wide range of different client systems. By adding new fields and types to the schema we can iterate on it without impacting existing queries. This allows us to evolve the schema gradually without disrupting integrated external systems.
Examples of Vessel API queries
The relational data (logbook) and time series data (measurements) require different kinds of datastores for efficient processing. With GraphQL we can combine both types of data into one coherent data model.
Let’s dive into what that looks like more specifically. Let’s start with simply finding out where all your ships are currently. The query for that looks like this.
{
  ships {
   id
   name
   position {
    track {
      dateTime
      latitude
      longitude
     }
   }
  }
}
Looks pretty logical, right? Any person who understands basic maritime concepts can understand the terms in the query. This query then returns data that may look a little something like this:
{
  "data": {
  "ships": [
    {
      "id": "b690bed3-ea6c-40de-83ce-723020bff814",
      "name": "Panta Rhei",
      "position": {
        "track": [
          {
              "dateTime": "2021-04-20T07:54:00Z",
              "latitude": 51.921532,
              "longitude": 4.03615
          }
        ]
      }
    },
    ... other ships left out for brevity
  ]
  }
}
The API returns a list of all the ships, and for each ship the id, name and position fields. The position field is a more complex type than just a string. Thus there we need to specify in more detail what should be returned exactly. In our case we just request a single position measurement latitude and longitude and the dateTime at which it was recorded.
But that is just the start of what is possible. If, for example, we’d just like to show the ship named Panta Rhei on a map we could change the query to look like this.
{
  ships(where: { nameIn: ["Panta Rhei"] }) {
    position {
      track {
        url
      }
    }
  }
}
Which will yield a result like this:
{
  "data": {
  "ships": [
    {
      "position": {
        "track": [
          {
              "url": "https://www.openstreetmap.org/?zoom=14&mlat=51.991482&mlon=4.041700&layers=D"
          }
        ]
      }
    }
   ]
  }
}
You see the result now only has an entry for a single ship, and instead of coordinates only a url to a map is returned.
This can be done for any kind of measurements on the ship. This query will return the total fuel consumed by engine-2 of the Reef Sprinter on April 20th 2021.
{
  ships(where: { nameIn: ["Reef Sprinter"] }) {
  id
  name
  fuelConsumption(
      where: {
         between: {
          from: "2021-04-20T00:00:00Z",
          until: "2021-04-21T00:00:00Z"
        }
     }) {
      byDevice(where: { nameIn: ["engine-2"] }) {
         fuelConsumption {
          liters
         }
      }
  }
  }
}
Up to this point we’ve only looked at measurements made on a given ship. The Onboard API also lets you retrieve measurements in the context of what the ship was doing at the time. Like this next query, it gives an overview of the total fuel consumption for each activity logged by the crew on the 20th of April 2021 on each of the ships.
{
  ships {
    name
    activities(where: {
      between: {
        from: "2021-04-20T00:00:00Z",
        until: "2021-04-21T00:00:00Z"
      }
    }) {
     started
     finished
     type {
       name
     }
     fuelConsumption {
      combined {
        liters
      }
    }
   }
  }
 }
Or you could find out which ship did the longest transit in April by looking at the distance of Transit activities. Like this:
{
  activities(
   where: {
     activityType: { nameIn: ["In Transit"] }
     between: {
       from: "2021-04-01T00:00:00Z",
       until: "2021-05-01T00:00:00Z"
     }
   }) {
   ship {
     name
   }
   started
   duration
   speedOverGround {
    speed {
      nauticalMiles
    }
  }
 }
}
Besides exposing day to day activities the API also has a section specifically designed for long term aggregate reporting. You could for example get all the weekly carbon emissions of 2020 for your whole fleet broken down by vessel like this:
query {
  report(
  filter: {
      date: {
         from: "2020-01-01T00:00:00Z",
         until: "2021-01-01T00:00:00Z"
       }
  }
   ) {
    byWeek {
    node {
        year
        weekOfYear
    }
    byShip {
        node {
         name
        }
        total {
         co2Emission
        }
      }
    }
  }
}
Get started in your own Onboard environment
This is just a brief taste of why companies like Shell and Streamba use the Vessel API, why we built it according to the GraphQL standard, and some of the queries and information you can access from it. As you can see, you can make simple queries, or highly complex queries that combine multiple data points. What you discover, and how you use that information, really is limited only by your imagination.
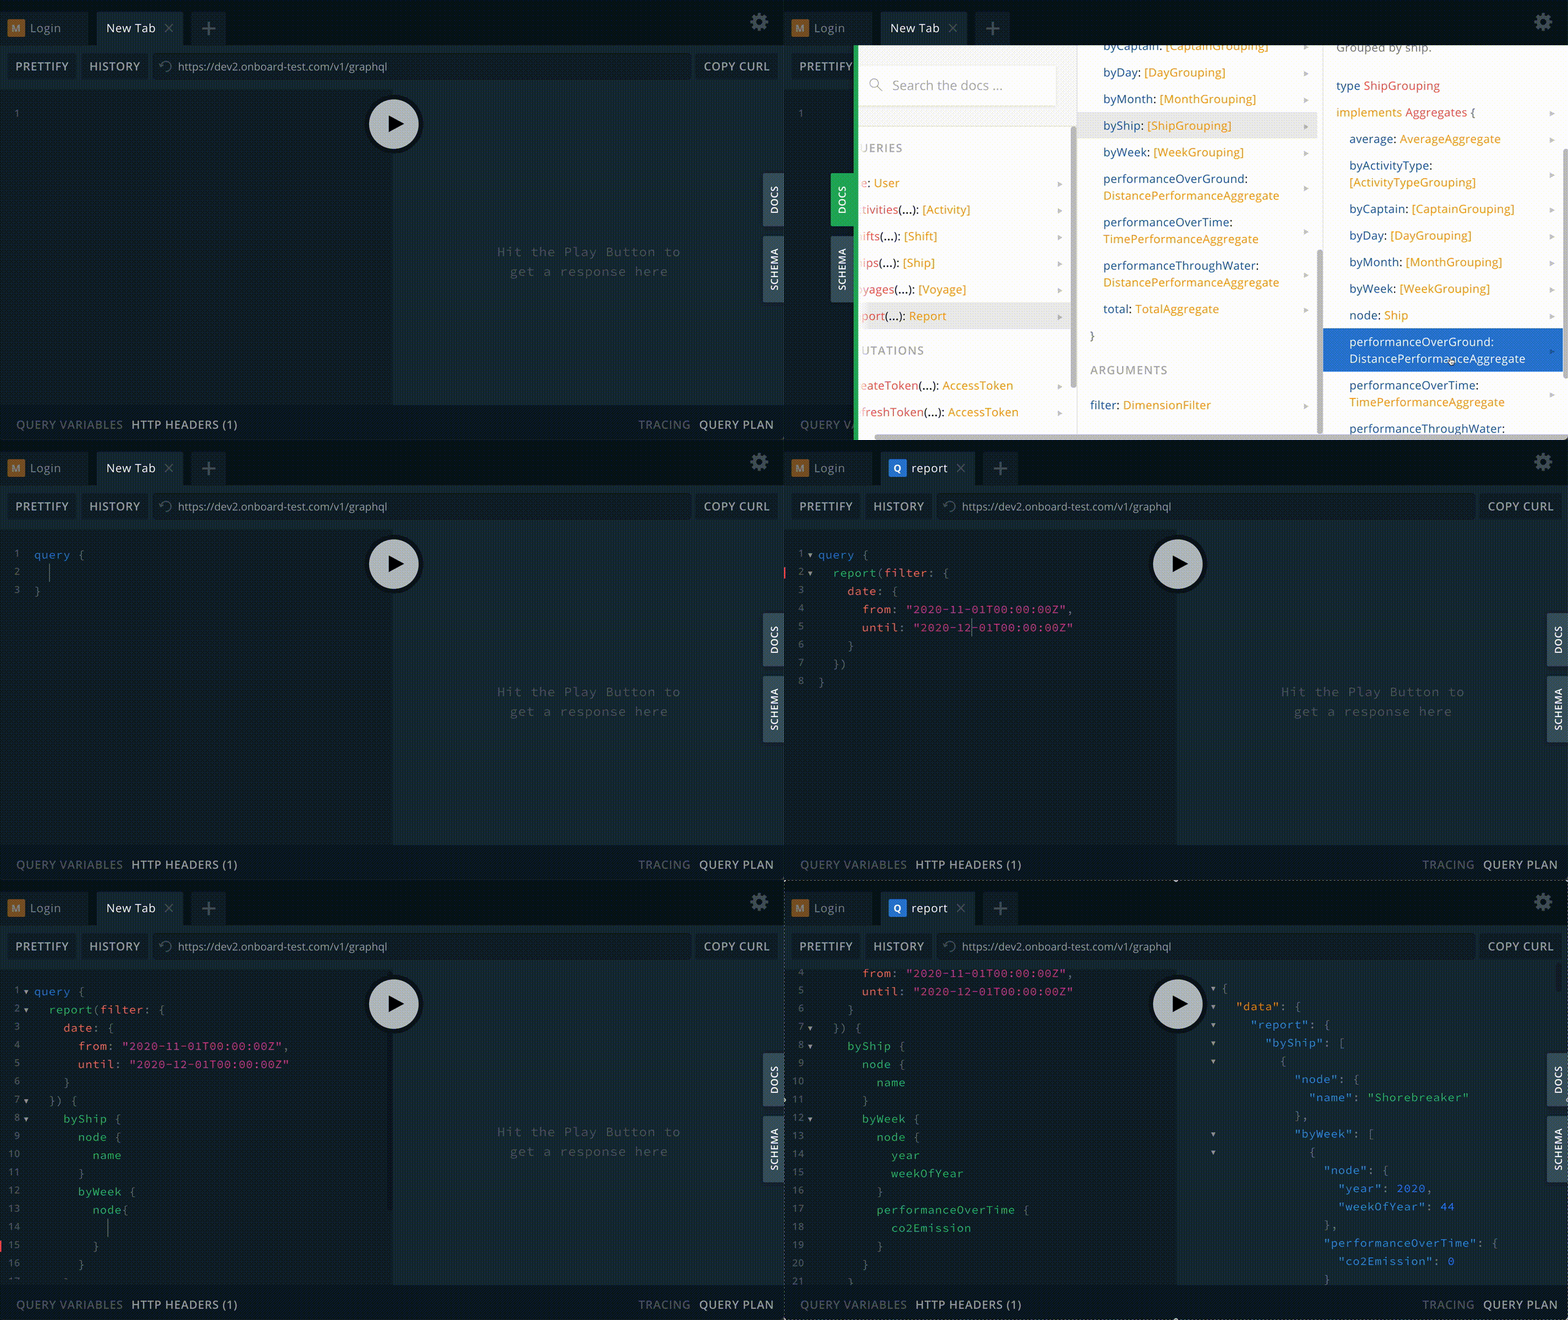
If you'd like to check it out in your own Onboard environment, you can go to https://<your-company-name>.onboard-app.com/v1/graphql. When you open this with your browser, an interactive GraphQL client is loaded that you can use to try some queries for yourself.
Interested in what you see? Please get in touch so we can provide you with access to our demo environment.

