Against a backdrop of increasing uncertainty in the global economy, as well as spiking oil prices, it is imperative for maritime businesses to operate more smartly and efficiently. As innovators and early movers pick up the pace it can be valuable to look at what they are doing to learn how to get started on these important initiatives.
Reinier Dick is Business Manager at marine and logistics provider Peterson, with over 30 years experience in maritime management and software roles, and graduating with a Master of Science in marine shipping innovation at NHL Stenden. Over the past several years he has been bringing a new focus on data into the organization to help find ways to improve operational efficiency and reduce CO2 emissions. We spoke to him about his approach.
Welcome Reinier! Can you please tell us a bit about your role and impact in your organization?
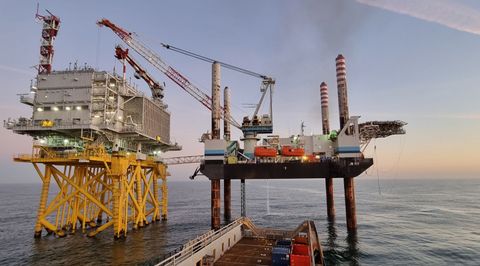
Yes, sure. Peterson provides marine and logistics coordination services to the Southern North Sea Pool (SNS Pool), a logistical facilitation between Peterson and energy businesses from the Dutch Oil and Gas industry (Element NL former NOGEPA ) and recently, EPIC contractors from the renewable sector. This is a complex operation that involves many customers, stakeholders, and vessels working together to service manned and unmanned offshore platforms over a large area.
In addition to the targets set by the SNS Pool steering committee around fuel consumption, like many maritime businesses Peterson den Helder wants to run more efficiently. Staff - and to an extent vessel - hiring costs are fixed, so saving fuel is the key way to reduce costs. And to save fuel we need to sail less miles, with more tons and fewer vessels, which is how we define efficiency, which is my key focus.
Where are the biggest areas you have been utilizing data to make gains?
This is a big question, so I will break it down into a few key areas. But first I want to stress one fundamental principle - there are countless ways to increase efficiency, but it all starts with measuring what your vessels are actually doing. This is critical not only to identify areas for improvement, develop the actual improvements and measure the results, but also to manage stakeholder conversations. When people are presented with hard data, conversations that weren’t possible become possible, and conversations that are already happening become a lot faster.
For an example, let’s look at one of the first big optimizations we made. If you look at a map of the area where the SNS Pool operates, you will see that many platforms from different operators are close together. In spite of this, we used to service most operators individually, which meant many unnecessary miles sailed, resulting in a waste of fuel and money. When we first pitched the idea of serving multiple operators with a single voyage there was resistance, because people were concerned that if the first operator caused a delay it would flow on to the second operator, and so on.
However, working with Onboard meant we were able to have real-time visibility into the operations of our vessels and crew. Therefore, we could use it to actually measure every delay in our operations and by doing that we mitigate the initial resistance, by actively monitoring possible negative side effects of this fundamental change to how we organize our operation.
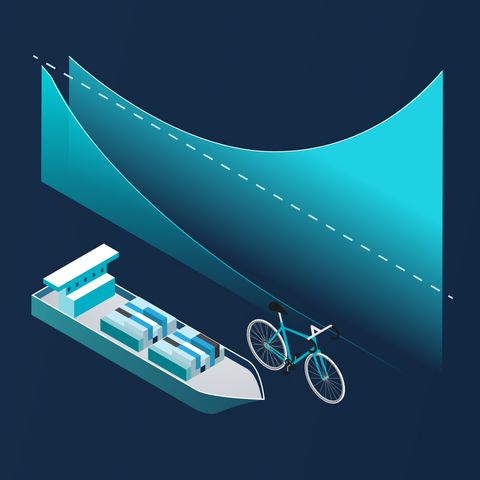
A second example of how we are using measured data is to find the optimal speed for each vessel. Originally, we sailed each vessel at approximately 10 knots. But we operate a diverse and changing fleet of vessels, with different designs, propulsion systems, and so on, and so it follows that the optimal speed for each will be a little different. We used Onboard to calculate vessel economic speed for every vessel individually and use these precise speeds for our voyage planning. If a vessel’s optimal speed is X, and a platform is Y miles away, it should leave at Z time.
We are also measuring vessel motion with Onboard and use this data to predict if a vessel is able to operate in certain weather conditions. This way we don’t waste voyages, avoid crew fatigue and discussions with customers, and are able to invest more efficiently in maintenance or other activities.
How do you keep track of and build on your optimizations?
We used to have a monthly manual reporting process but now that our fleet is connected, we do this in real-time with data from Onboard. We have integrated Onboard with our Microsoft Power BI dashboarding solution. Here we combine vessel operational data from Onboard with sailing forecast data and shoreside operational data from Lighthouse, which helps us focus on monitoring our operations and measuring our initiatives.
For example, we are now monitoring how often each vessel exceeds its defined economical speed for each vessel. In recent months we saw an increase of vessels exceeding their defined economical speed from 42% to 50%, due to a demand increase. However, on average we still see a substantial reduction in average sailing speed from 7.7 knots to 7.2. And on top of that where we previously used eight vessels, because of the combined improvements we now use six vessels for the same workload. As you can imagine, these initiatives are saving a substantial amount of money.
There are many more areas we are optimizing, such as our departure and arrival times - we now do a lot of sailing at night and working during the day, for example, with much less idle time as a result. And another is running simulations for different planning scenarios based on vessel operational data to make smarter decisions.
We share data and best practices with our captains and vessel owners. As a result, we see an increase in commitment, and in some cases crews start to compete. The data that we share with vessel owners is often a bit different to what is on their own specifications. But by and large vessel owners have been grateful to learn about how their vessels really operate, and see the information as extremely valuable - and it also helps with contract negotiations.
In the interests of time I’ll leave it there.
What is your advice to other maritime businesses?
There are enormous opportunities to utilize data to run vessels and organizations more efficiently than ever before, but very few maritime businesses are grasping this opportunity, due to two related reasons. The first reason is that maritime organizations are simply not thinking enough about data. And the second reason is that they are not measuring anything to establish a baseline. And because they are not measuring what is actually happening on their vessels, they don’t know what efficiency looks like.
Every maritime business would benefit from thinking about data and efficiency. And with the right tools, you don't need to be a data analyst. In fact, operational expertise is the most important attribute you need to get started.
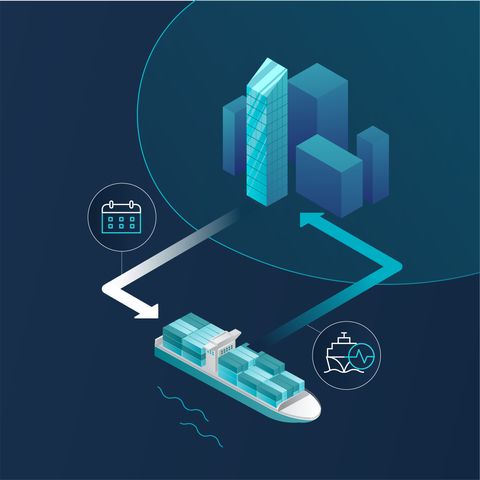
Another other key thing I advise is to not just focus on vessels. The serious gains are made by optimizing the supply chain that your vessels are part of, and working together with stakeholders and the tools that support it to improve the supply chain as a whole.

