One Size Doesn’t Fit All—Your Data, Your KPIs
Standard dashboards can only take you so far—especially in maritime operations where every business, vessel, and workflow is unique. With Onboard Dashboards, you’re not locked into predefined views. Instead, you can group, filter, and transform your data your way, building custom KPIs that reflect how your operation truly runs.
Create your own dashboards from day one—or work with the Onboard team to tailor visualizations to your specific needs.

Look Beyond the Vessel
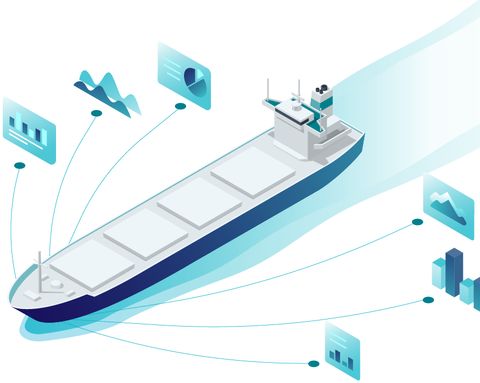
A vessel doesn’t operate in isolation—its performance is shaped by the entire ecosystem around it. With Onboard Dashboards, you can combine crew-logged events with real-time sensor data to measure how external factors like supply chain partners, port layout, weather, and other environmental conditions impact performance.
This broader view unlocks deeper insight and reveals efficiency gains that aren’t visible when analyzing the vessel alone.

From Data Capture to Analytics—All in One Platform
Onboard offers a fully integrated, end-to-end solution—covering the entire data journey. From capturing high-frequency data on board your vessel to delivering real-time analytics in your dashboard, everything works out of the box.
Install the plug-and-play Onboard Maritime IoT Gateway, and you're ready to go. No complex setup, no patchwork systems—just powerful insight from ship to shore.
-
Connect Ship
Collect
Capture data from any machine, system, or sensor on board—transforming your vessel into a smart, data-rich asset.
-
Connect Crew
Contextualize
Enrich raw sensor data with crew-entered logs and event data to create a complete operational picture.
-
Vessel API
Access
Use the Vessel API to access everything through a single GraphQL endpoint—ideal for integrations, apps, or custom tools.
-
Analyze
Slice, group, and visualize data across your fleet with Onboard Dashboards—turning operations into insights and insights into action.